|
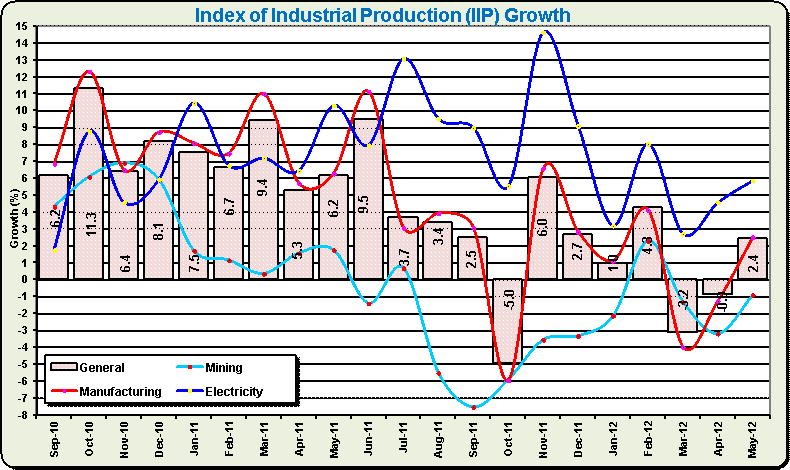
India's industrial production increased above expectations at 2.4% during May 2012. The increase in industrial production for May 2012 was above market expectations of 1.8% growth projected for the month. The industrial production growth in May 2012 improved with the rebound manufacturing growth to 2.5% in May 2012, snapping fall for last two months. The electricity generation growth also galloped to 5.9% in May 2012, but the mining sector continues to record negative growth at 0.9% for May 2012 over May 2011.
As per the poll of economists conducted by Capital Market, India's industrial production was expected to increase 1.8% during May 2012. The economists responding to the poll had forecasted the IIP growth in the wide range of 0.1% to 3.6% for May 2012. The median of various IIP growth forecast stood at 1.8%, while the average was lower at 1.6% for May 2012.
As per the used based classification, the output of capital goods continued to record fall for third straight month at 7.7% in May 2012. The continued fall in capital goods production remains a major drag on industrial production, contributing mainly to the overall subdued growth of the industrial production. However, the intermediate goods output growth tuned positive at 2.7%, snapping fall for previous two months. The growth of the basic goods production improved to 4.1% in May 2012, while the output of consumer goods further galloped to 4.3% in May 2012. Among the consumer goods, the consumer durable output surged 9.3%, while that of consumer non-durable rose mere 0.14% in May 2012.
In terms of industries, only ten (10) industry groups out of the twenty two (22) industry groups in the manufacturing sector have shown positive growth, indicating widespread slackening of activity. The industry group Radio, TV and communication equipment & apparatus' has shown the highest growth of 16.4%, followed by 13.7% in ' Machinery and equipment' and 12.6% in 'Fabricated metal products, except machinery & equipment'.
On the other hand, the industry group 'Electric Machinery and apparatus n.e.c.' has shown a negative growth of 28.6% followed by 14.9% in ' Furniture; manufacturing n.e.c.' and 6.8% in 'Wearing apparel; dressing and dyeing of fur'.
Some of the important items showing high positive growth during the current month over the same month in previous year include ‘Telephone Instruments including Mobile Phone & Accessories' (22.8%), ‘Air Conditioner (Room)' (30.0%), ‘Carbon Steel' (23.5%), ‘Plastic Machinery including Moulding Machinery' (49.6%), ‘Conductor, Aluminium' (58.1%), ‘CR Sheets' (30.1%), ‘Steel Structures' (28.5%), ‘Boilers' (28.8%), ‘Purified Terephthalic Acid' (23.3%) and ‘Aerated Water & Soft Drinks' (25.1%).
Some of the other important items showing high negative growth are: ‘Cable, Rubber Insulated' [(-) 66.6%], ‘Gems and Jewellery' [(-) 23.4%], ‘Sugar' [(-) 49.8%], ‘Vitamins' [(-) 62.2%], ‘Furnace Oil' [(-) 30.6%], ‘Colour TV Sets' [(-) 25.9%], , ‘Colour TV Picture Tubes' [(-) 87.6%], ‘Di Ammonium Phosphate (DAP)' [(-) 46.9%], ‘Edible Hydrogenated Oil' [(-) 42.7%], ‘Complex Grade Fertilizers' [(-) 46.7%] and ‘Textile Machinery' [(-) 30.5%].
The indices for April 2012 have undergone the first revision and those for February 2012 have undergone the final revision in the light of the updated data received from the source agencies. The growth of the industrial production for February revised upward to 4.29% compared to 4.11% reported earlier, while that for April 2012 was revised downwards to (-) 0.9% from 0.1% reported earlier.
Contribution to Growth
The manufacturing index contributed 200 bps or 83.1% (with new 2004-05 base) of the 2.41% growth in industrial production during May 2012. The electricity sector also contributed to the growth of the industrial production by 56 bps or 23.2% during May 2012. However, the mining sector posting 0.9% decline impacted the growth of the industrial production contributing negatively by 10 bps during May 2012.
Among the 22 manufacturing industries group, the industry groups ‘Radio, TV and communication equipment & apparatus' and ‘Machinery and equipment' had a largest positive contribution of 78 bps and 73 bps, respectively to IIP growth in May 2012. The industry groups ‘Basic metals' and ‘Fabricated metal products, except machinery & equipment' also had a positive contribution of 62 bps and 40 bps, respectively. Further, the industry groups ‘Textiles', ‘Other non-metallic mineral products' and ‘Motor vehicles, trailers & semi-trailers' served to IIP growth with the positive share of 40 bps, 33 bps and 32 bps in May 2012.
The industry groups, ‘Rubber and plastics products', Coke, refined petroleum products & nuclear fuel' and ‘Coke, refined petroleum products & nuclear fuel' also had a positive share of 19 bps, 16 bps and 12 bps, respectively in IIP growth.
On the other hand, the industry groups, ‘Electrical machinery & apparatus' had the largest negative contribution of 132 bps in the 2.41% growth in industrial production followed by ‘Furniture; manufacturing n.e.c.' group contributing (-) 40 bps during May 2012. The industry group ‘Chemicals and chemical products' and ‘Wearing apparel; dressing and dyeing of fur' also had a negatively share of 16 bps each to the IIP growth in May 2012. Further, the ‘Food products and beverages', ‘Paper and paper products' and ‘Medical, precision & optical instruments, watches and clocks' also had a negative contribution of 05 bps, 03 bps and 02 bps, respectively to the IIP growth.
As per the use-based classification, Capital goods had a negative contribution of 101 bps to 2.41% growth in the industrial production during May 2012. Intermediate goods contributed positively by 37 bps. The basic goods had a largest positive share of 168 bps, while consumer non-durable and consumer durables also had a positive contribution of 134 bps and 03 bps to IIP growth during May 2012.
Major indicators for June 2012
- Auto production (excluding tractors) increased 6.5% to 1700675 units in June 2012. The automobile production carries 5.46% weight in the Index of Industrial Production.
- The freight traffic of the Indian Railway improved 5.2% to 80.43 million tonnes during June 2012 and 4.8% to 244.81 million tonnes in May-June 2012.
- Electricity generation increased 8.1% to 76305.69 Gwh in June2012.
- Indirect tax collection grew 14.8% to Rs 37748 crore in June 2012.
- Gross Direct Tax collections during May-June 2012 moved up 6.77% to Rs 111182 crore as against Rs 104135 crore in the same period during the last year.
- The seasonally adjusted HSBC Purchasing Managers Index (PMI), a headline index designed to measure the overall health of the manufacturing sector, posted 55.0 in June little-changed from the reading of 54.8 in May 2012.
- The HSBC India Composite Output Index rose in June, posting 55.7 up from 55.3 in May 2012.
Experts Views
Sonal Varma, India Economist, Nomura
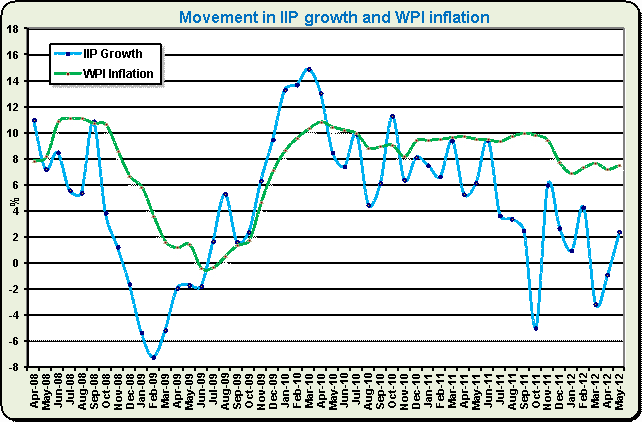
The outlook remains subdued. While a weak currency and increased mining activity are positives, they may not be sufficient to offset the drag from weak domestic and external demand. Indicators such as production cuts by auto majors, weak excise collections and falling non-oil import growth all suggest that activity remains weak. We expect IP growth to slow sharply next month. The falling trend in consumer non-durables is particularly worrying, given that there is an additional risk from a weak monsoon. Average industrial output growth in Q2 (Apr-May) now stands at 0.8%, compared to 0.5% in Q1, broadly consistent with our real GDP growth forecast of 5.4% y-o-y in Q2. While weak growth calls for policy easing, sticky headline WPI inflation due to elevated food prices and INR depreciation constrains action. We expect WPI inflation (released on 16 July) to inch slightly higher to 7.58% y-o-y from 7.55% in May. As such, we expect the Reserve Bank of India to cut its GDP growth estimates but to keep policy rates unchanged at its 31 July policy meeting.
Leif Lybecker Eskesen, Chief Economist for India & ASEAN, HSBC
The uptick in growth momentum was foreshadowed by leading indicators, including manufacturing PMI, cement dispatches, and the infrastructure index. However, we do not expect industrial production to come roaring back.
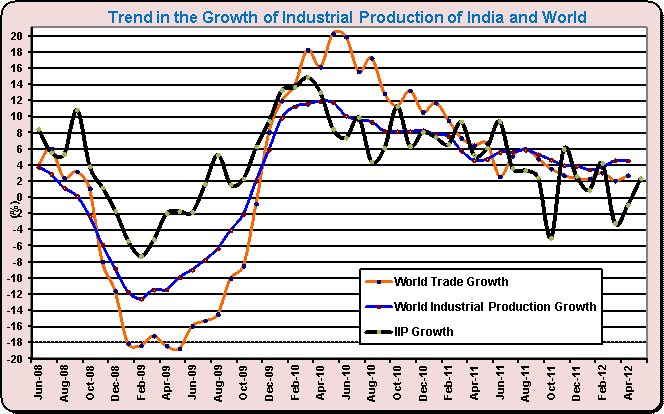
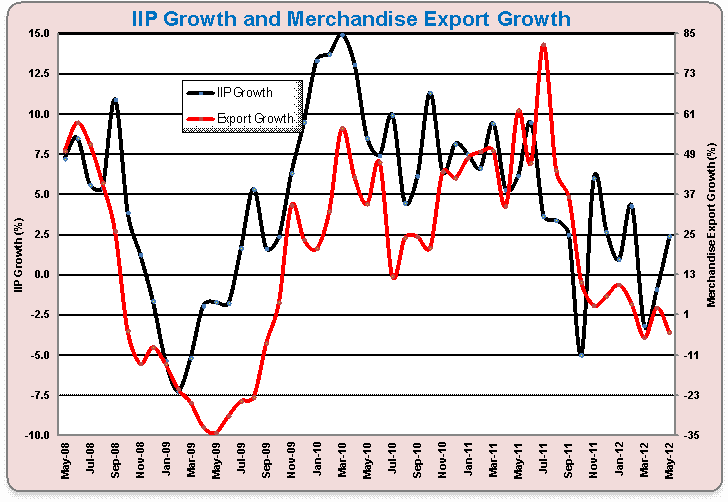
Manufacturing is more exposed to global trade cycle. While, there are signs of improvement in exports led sectors, possibly due to improved competitiveness on the back of a depreciated currency, the weak global backdrop will continue to hinder a sustained rise in external demand.
While domestic consumption remains quite firm supported by demographics and favorable labour markets, the investment cycle remains face headwinds from global uncertainty and slow progress of supply side reforms.
Monetary policy is of little help given that the slowdown to a large extent is structural in nature. Moreover, RBI is constrained by persistently high inflation. On this front, the below normal rainfalls so far during the monsoons doesn't help either, although it is still early days and rainfalls could still pick up during July and August. Consequently, there is not a strong case for a policy rate cut at the moment.
Industrial production picked up on an improved sequential momentum and last year's low base. However, growth remains moderate and will remain constrained going ahead, but high inflation and the structural nature of the slowdown limits the scope for RBI to move.
CRISIL
Industrial output, after registering negative growth for two consecutive months, grew at 2.4% in May 2012. Manufacturing and electricity sector grew at 2.5 and 5.9% respectively. However, mining sector contracted for the third consecutive month and registered a negative growth of 0.9%. Core industries output continues to remain weak. Unless some policy reforms are undertaken quickly to revive growth, given the depressed domestic and global macro environment we expect industrial output growth to remain weak in the near term.
Aditi Nayar, Sr. Economist, ICRA
The overall sluggishness in the industrial sector persists in spite of the slight up tick in IIP growth in May 2012. The considerable easing in the de-growth in capital goods output in May 2012 is likely to reflect lumpiness in order completion, and is unlikely to sustain in the near term given the lack of appreciable improvement in investment activity. Moreover, an adverse base effect may contribute towards a weaker industrial growth rate for June 2012. However, drier weather conditions may provide a limited boost to mining activities.
Dhananjay Sinha, Economist and Strategist, Emkay Global Financial Services
While May 2012 IIP growth has shown some positive surprise, unlike previous two months when we were being negatively surprise, we suspect that the final growth number may be much weaker. We think that consumer goods production growth are not been supported by demand indicators thereby implying lack of momentum going forward. In addition, there can also be downward revision for capital sector growth. In all we maintain a 4% IIP growth for full year FY13E. We also maintain that there may not be any substantive easing announcement by RBI on Jul 31. Importantly, low growth and still high inflation (June'12 WPI inflation expected at 7.6% and CPI above 10%) signify stagflation situation. The backdrop for the monetary policy by the month end will unlikely be different from RBI's last statement when it decided to keep the policy rates unchanged.
Outlook
There is acceleration in the pace of growth in India's Index of Industrial production in the past couple of months. From 3.1% fall in March 2012, the fall in production was restricted to 0.9% in April 2012, which gave way for 2.4% improvement in May 2012. Such improvement is visible in all the use based sectors. Even in capital goods sector, which recorded 7.7% fall in May 2012, is infact an improvement from 19.6% fall in April 2012 and 20.3% fall in March 2012. On the other hand, the consumer durables recorded impressive acceleration from 1.0% increase in March 2012 to 5.2% rise in April 2012, and 9.3% spike in May 2012. So, as a country, India is recording improvement in its manufacturing sector. Only the growth remains well below our potential and is sub-optimal.
The sentiments have improved in the recent times, but for such sentiments to sustain and transform into improvement in business activities, there needs to be concerted efforts on both fiscal and monetary side. While cutting repo / CRR rate will be difficult in the context of high inflation and poor South West Monsoons, that leaves way for slew of fiscal initiatives, which needs to be done priority basis.
| Index of Industrial Production (2-Digit Level) (Base: 2004-05:100) |
| Industry Group |
Weight |
Growth (%) |
Contribution to Growth (bps) |
| May 2012 |
Apr-May 12 |
May-12 |
Apr-May 12 |
| Food products and beverages |
72.76 |
-0.79 |
1.77 |
-0.05 |
0.12 |
| Tobacco products |
15.7 |
-1.30 |
-4.49 |
-0.01 |
-0.05 |
| Textiles |
61.64 |
8.62 |
5.24 |
0.40 |
0.25 |
| Wearing apparel; dressing and dyeing of fur |
27.82 |
-6.79 |
-8.26 |
-0.16 |
-0.20 |
| Luggage, handbags, saddlery, harness & footwear; tanning and dressing of leather products |
5.82 |
7.00 |
5.87 |
0.03 |
0.02 |
| Wood and products of wood & cork except furniture; articles of straw & plating materials |
10.51 |
-1.80 |
-2.81 |
-0.02 |
-0.03 |
| Paper and paper products |
9.99 |
-3.28 |
-1.53 |
-0.03 |
-0.01 |
| Publishing, printing & reproduction of recorded media |
10.78 |
11.61 |
12.55 |
0.12 |
0.13 |
| Coke, refined petroleum products & nuclear fuel |
67.15 |
3.09 |
0.16 |
0.16 |
0.01 |
| Chemicals and chemical products |
100.59 |
-2.14 |
-1.72 |
-0.16 |
-0.13 |
| Rubber and plastics products |
20.25 |
8.40 |
7.60 |
0.19 |
0.17 |
| Other non-metallic mineral products |
43.14 |
8.23 |
6.94 |
0.33 |
0.28 |
| Basic metals |
113.35 |
4.83 |
3.80 |
0.62 |
0.48 |
| Fabricated metal products, except machinery & equipment |
30.85 |
12.58 |
10.58 |
0.40 |
0.33 |
| Machinery and equipment n.e.c. |
37.63 |
13.67 |
9.18 |
0.73 |
0.51 |
| Office, accounting & computing machinery |
3.05 |
-2.75 |
-9.16 |
-0.01 |
-0.02 |
| Electrical machinery & apparatus n.e.c. |
19.8 |
-28.56 |
-40.95 |
-1.32 |
-2.17 |
| Radio, TV and communication equipment & apparatus |
9.89 |
16.38 |
18.70 |
0.78 |
0.85 |
| Medical, precision & optical instruments, watches and clocks |
5.67 |
-5.41 |
8.60 |
-0.02 |
0.03 |
| Motor vehicles, trailers & semi-trailers |
40.64 |
5.49 |
2.60 |
0.32 |
0.16 |
| Other transport equipment |
18.25 |
2.91 |
1.14 |
0.07 |
0.03 |
| Furniture; manufacturing n.e.c. |
29.97 |
-14.88 |
-10.74 |
-0.40 |
-0.27 |
|
|
|
|
|
|
| Mining |
141.57 |
-0.90 |
-2.03 |
-0.10 |
-0.22 |
| Manufacturing |
755.27 |
2.52 |
0.63 |
2.00 |
0.50 |
| Elect. |
103.16 |
5.87 |
5.25 |
0.56 |
0.49 |
| General |
1000 |
2.41 |
0.75 |
2.41 |
0.75 |
| Used Based Classification (Monthly Growth in %) (2004-05 Base) |
| Period |
Basic Goods |
Capital Goods |
Intermediate Goods |
Consumer goods |
General |
| Total |
Durables |
Non-durables |
| Weight |
456.82 |
88.25 |
156.86 |
298.08 |
84.6 |
213.47 |
1000 |
| Apr-09 |
1.1 |
-14.2 |
-0.9 |
-1.2 |
9.3 |
-7.8 |
-1.9 |
| May-09 |
1.6 |
-9.8 |
-1.6 |
-2.4 |
0.9 |
-4.8 |
-1.7 |
| Jun-09 |
7.2 |
-23.1 |
-0.7 |
-1.1 |
1.2 |
-2.7 |
-1.8 |
| Jul-09 |
3.4 |
-15.3 |
0.7 |
8.0 |
12.8 |
4.7 |
1.7 |
| Aug-09 |
4.6 |
-1.0 |
7.4 |
8.5 |
9.8 |
7.4 |
5.3 |
| Sep-09 |
2.0 |
-2.6 |
6.6 |
1.4 |
5.6 |
-1.9 |
1.6 |
| Oct-09 |
3.0 |
-4.3 |
6.0 |
3.5 |
7.3 |
0.3 |
2.4 |
| Nov-09 |
6.1 |
-8.1 |
8.0 |
12.8 |
30.5 |
2.0 |
6.3 |
| Dec-09 |
5.8 |
4.8 |
12.4 |
15.1 |
46.5 |
0.2 |
9.5 |
| Jan-10 |
8.7 |
14.3 |
14.2 |
18.6 |
57.4 |
0.0 |
13.3 |
| Feb-10 |
5.6 |
39.4 |
10.3 |
16.6 |
28.9 |
8.7 |
13.7 |
| Mar-10 |
7.4 |
48.6 |
11.0 |
12.6 |
13.0 |
12.4 |
14.9 |
| Apr-10 |
6.7 |
35.5 |
11.9 |
13.8 |
23.3 |
6.8 |
13.1 |
| May-10 |
6.1 |
15.8 |
11.7 |
7.4 |
14.7 |
1.9 |
8.5 |
| Jun-10 |
3.7 |
3.7 |
8.5 |
13.3 |
21.2 |
7.5 |
7.4 |
| Jul-10 |
4.5 |
40.7 |
8.5 |
5.8 |
14.8 |
-0.9 |
9.9 |
| Aug-10 |
3.8 |
4.6 |
5.9 |
4.6 |
8.1 |
1.8 |
4.5 |
| Sep-10 |
3.5 |
7.2 |
4.6 |
9.7 |
14.2 |
5.8 |
6.2 |
| Oct-10 |
9.8 |
21.1 |
9.7 |
9.3 |
14.2 |
5.0 |
11.3 |
| Nov-10 |
5.7 |
25.7 |
4.3 |
0.7 |
7.2 |
-4.4 |
6.4 |
| Dec-10 |
7.8 |
20.2 |
8.1 |
3.5 |
7.8 |
0.6 |
8.1 |
| Jan-11 |
7.7 |
5.3 |
7.4 |
8.3 |
12.5 |
5.0 |
7.5 |
| Feb-11 |
5.5 |
-5.7 |
6.3 |
13.4 |
18.2 |
9.7 |
6.7 |
| Mar-11 |
6.4 |
14.5 |
3.0 |
13.2 |
14.9 |
11.9 |
9.4 |
| Apr-11 |
7.1 |
6.6 |
3.9 |
3.2 |
1.6 |
4.6 |
5.3 |
| May-11 |
7.5 |
6.2 |
0.1 |
7.2 |
5.1 |
9.0 |
6.2 |
| Jun-11 |
7.8 |
38.7 |
1.6 |
3.1 |
1.6 |
4.3 |
9.5 |
| Jul-11 |
10.0 |
-13.7 |
-0.1 |
6.4 |
9.0 |
4.1 |
3.7 |
| Aug-11 |
5.8 |
4.0 |
-1.0 |
2.1 |
5.5 |
-0.7 |
3.4 |
| Sep-11 |
5.3 |
-6.5 |
-1.4 |
5.7 |
8.9 |
2.7 |
2.5 |
| Oct-11 |
1.2 |
-26.5 |
-8.4 |
0.1 |
-0.4 |
0.5 |
-4.9 |
| Nov-11 |
6.5 |
-4.7 |
1.3 |
12.8 |
10.4 |
15.0 |
6.1 |
| Dec-11 |
5.5 |
-16.0 |
-1.5 |
10.1 |
5.1 |
13.8 |
2.7 |
| Jan-12 |
1.9 |
-2.7 |
-2.5 |
2.5 |
-7.5 |
10.6 |
1.0 |
| Feb-12 |
7.6 |
10.5 |
1.0 |
-0.4 |
-6.2 |
4.4 |
4.2 |
| Mar-12 |
0.9 |
-20.3 |
-1.7 |
1.2 |
1.0 |
1.2 |
-3.1 |
| Apr-12 |
2.1 |
-19.6 |
-1.6 |
3.7 |
5.2 |
2.5 |
-0.9 |
| May-12 |
4.1 |
-7.7 |
2.7 |
4.3 |
9.3 |
0.1 |
2.4 |
| Source: MOSPI |


|